SciSketch
The world's first AI-powered life science illustrator
Github Repository
SciSketch is the world’s first AI-powered life science illustrator – You can think about it as the AI-powered BioRender. Creating complex molecular and biochemical illustrations for research manuscripts can be a tedious and time-consuming task. Existing tools, like BioRender, require users to manually select, arrange, and annotate icons on a digital canvas, which can be frustrating and redundant. This process often leads to scientists spending significant time on creating visuals instead of focusing on their research.
SciSketch addresses these challenges by offering a streamlined and automated solution for generating professional science figures. By leveraging advanced algorithms, SciSketch transforms detailed textual information into clear, concise, and visually appealing diagrams in seconds. This innovative tool not only saves time but also ensures that scientific illustrations are accurate and high-quality.
With SciSketch, researchers can efficiently create the necessary visuals for their manuscripts, grant proposals, and presentations, allowing them to dedicate more time to their scientific discoveries and advancements.
Prototype Demo
Watch the first iteration of SciSketch’s prototype and its Repo, built solely with React, Flask, and the OpenAI API at the 2024 Penn Generative AI Hackathon:
Tech stack
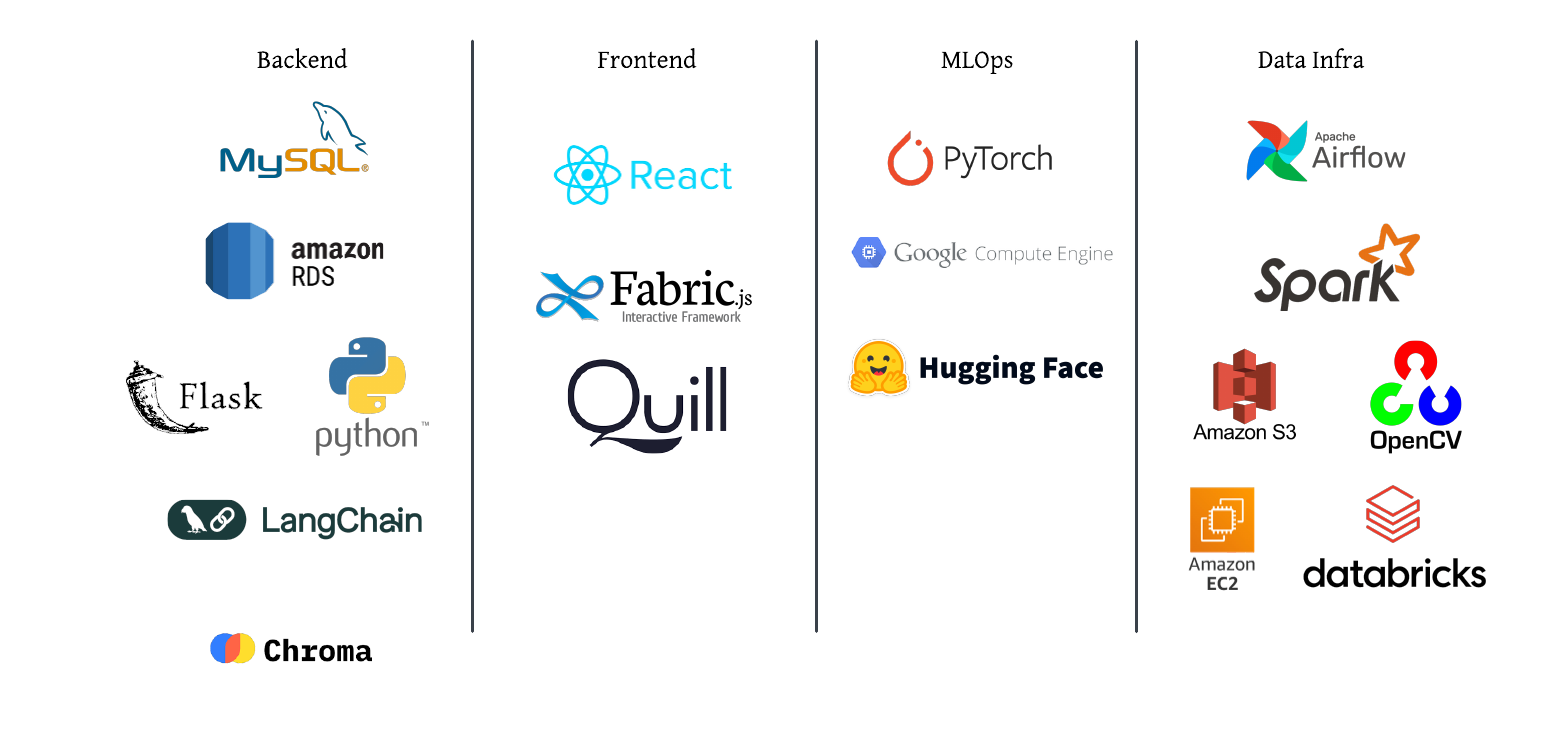
Coming soon: new automated backend continuous finetuning feature with MySQL and Apache Airflow!
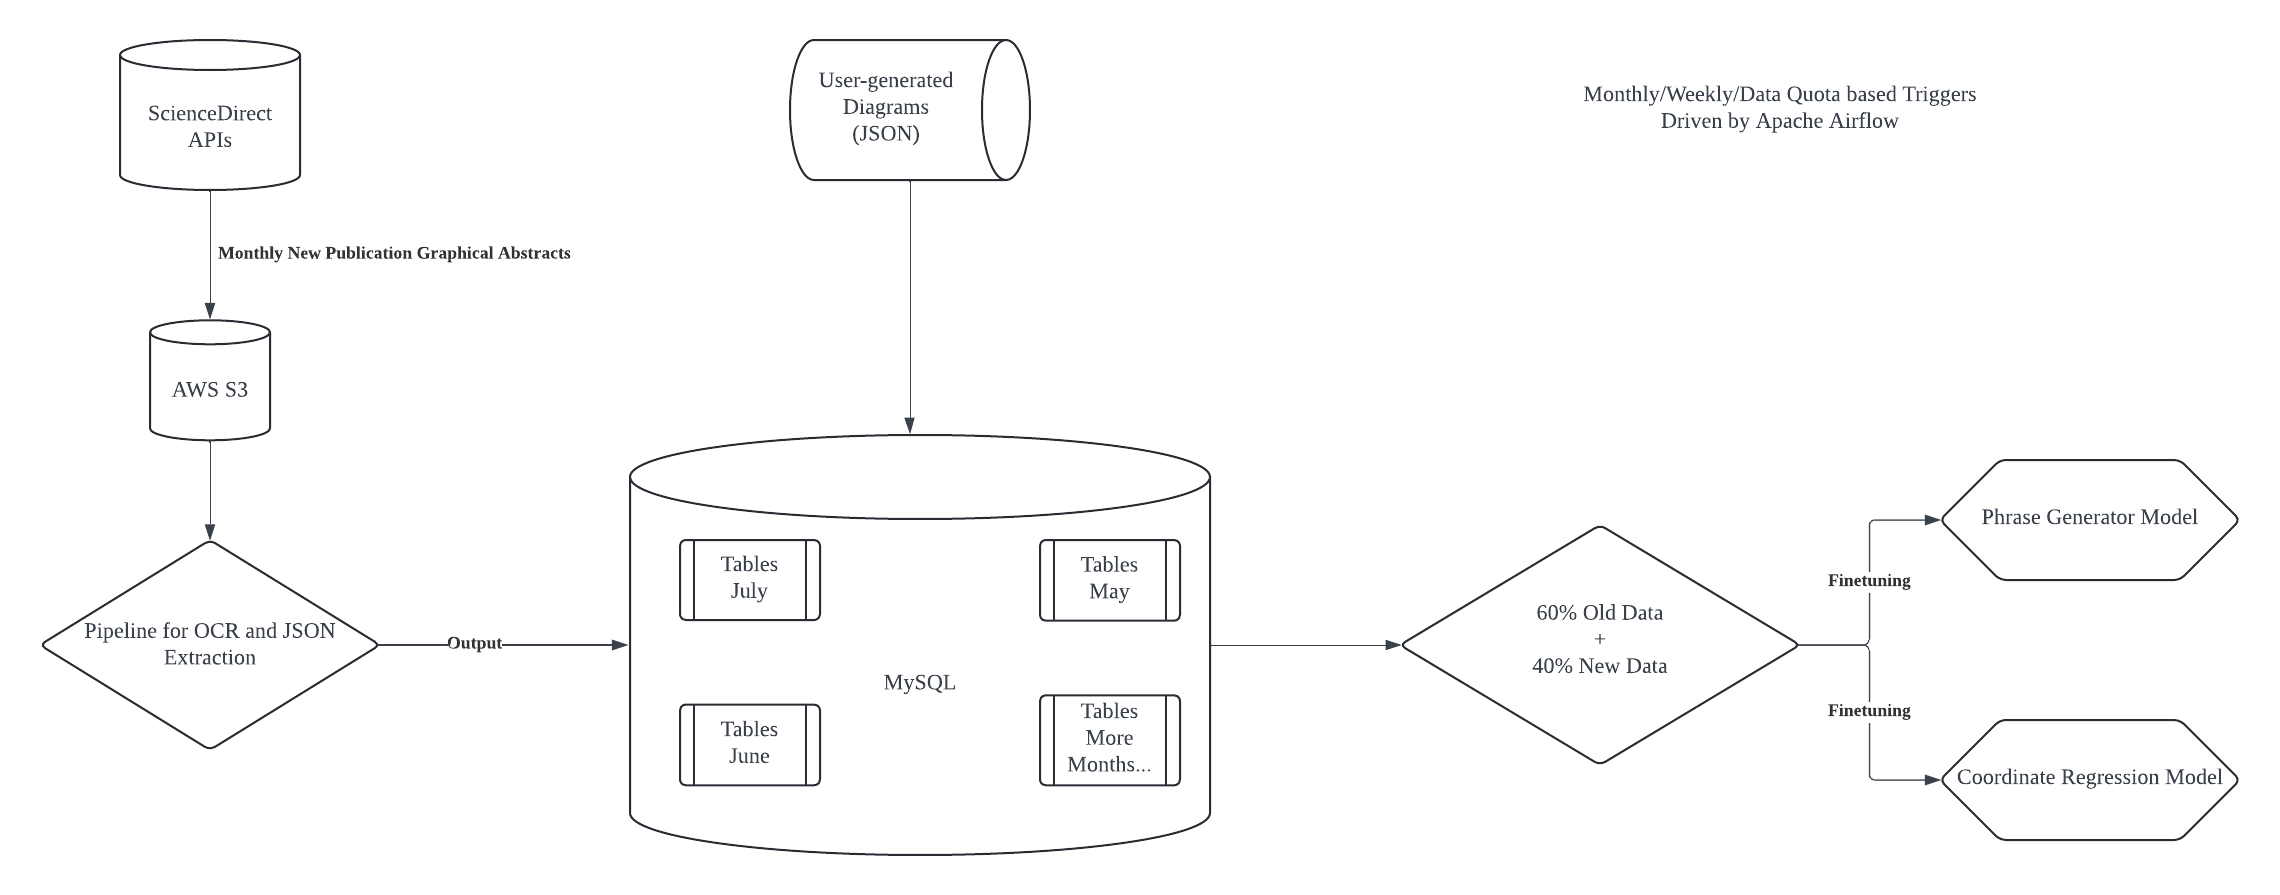
This new backend framework promises to save SciSketch devs 60% time in dev and MLOps work and increase training dataset by at least 180%.
BioIllustra: The Training Dataset
Check out the dataset itself on Hugging Face!
To create SciSketch, I created BioIllustra, a dataset consisting of 30,000+ biomedical text abstracts and their corresponding graphical abstracts. To create BioIllustra, I utilized the ScienceDirect API to collect data from more than 50,000 published research articles in Cell Press. Then, I used OCR and DBSCAN clustering to extract the text entities in the graphical abstracts, as well as their coordinates and width, height in the graphic. The extracted information is presented in JSON format to accommodate downstream model training purposes.
IconIllustra: The Icons Dataset
The model needs icons it can call to convert the JSON output from inference into graphics. This step involves an important feature that maps biomedical texts to graphical icons with similar semantic meaning. To do this, I decided to utilize embedding similarity search. By converting the icons’ descriptive file name to vector embeddings with ChatGPT4-Turbo and storing the vector embeddings as well as the icon images as key-value pairings in a vector database (ChromaDB), each output text from model inference can be quickly and accurately mapped to icon images.
Model Finetuning
I chose BERT-T5 (11b) as the foundational, pretrained model for the finetuning process. T5 uses an encoder-decoder architecture, enabling it with both deep, bidirectional contextual understanding of input text and text generation abilities. To construct a GPU-enabled computing environment with relatively low cost, I utilized Google Cloud’s Compute Engine to instantiate a Linux virtual machine with 1x NVIDIA A100.
Model Deployment
To deploy the model quickly and scalably in an MVP beta testing version to quickly gain user feedback and iterate & improve, we will be hosting the finetuned model on cloud servers for inference and the frontend in Google Workspace Add-on so people can use it as a plug-in for Google Docs. However, we are also building a full-stack webapp with the MERN-stack, with the graphic editing view built with Fabric.js and the text editing view built with Quill.js, so that in the long term we can have our own webapp for developing more features.