MEAnalysis
R-package for automated neuron multielectrode array experiment data analysis
Github Repository
This open-source R package is designed for Penn Epigenetics Institute internal use in efficient analysis of neuron electrode experiment data analysis. It provides tools for analyzing Microelectrode Array (MEA) data. The institute recently started doing multielectrode array assays, but found existing ways to analyze and visualize MEA machine output to be limited in illustrative power. The institute need a tool that efficiently and quickly analyze and visualize the output from the MEA machine.
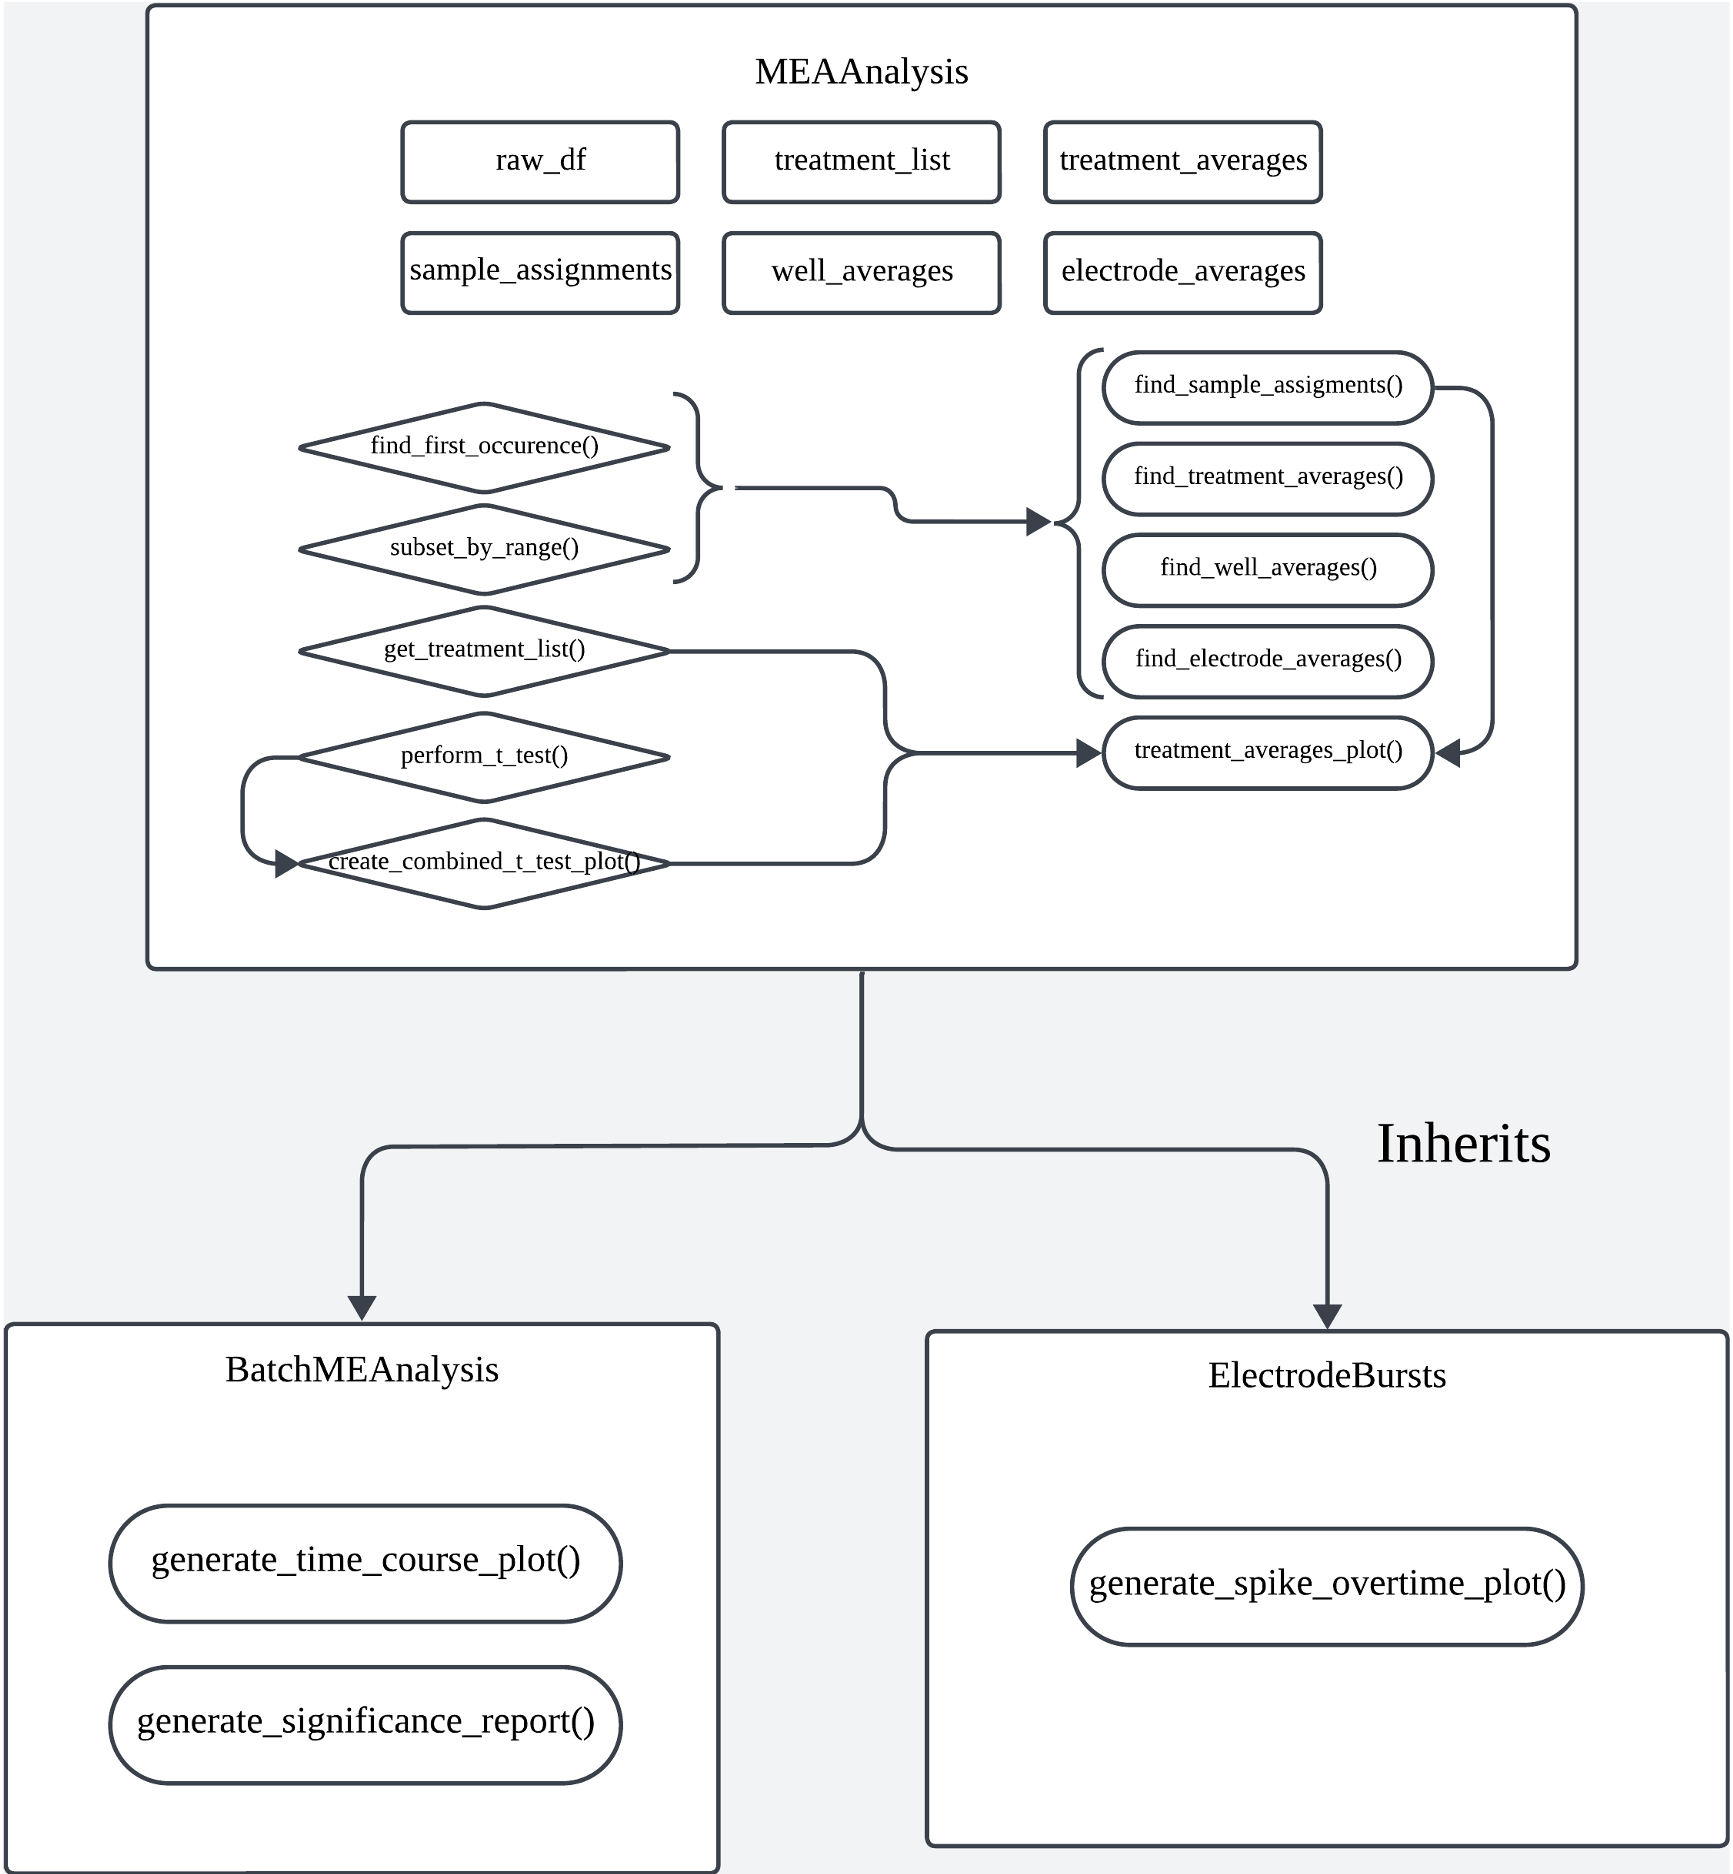
This R-pacakge is developed out of this need. In its design, I leveraged object-oriented programming principles and prioritized ease to use, accuracy for scientific computing, scalability, and codebase maintainability. It includes three main classes: MEAnalysis, BatchMEAnalysis, and ElectrodeBursts.
Codebase Diagram
Example Visualizations Generated by MEAnalysis
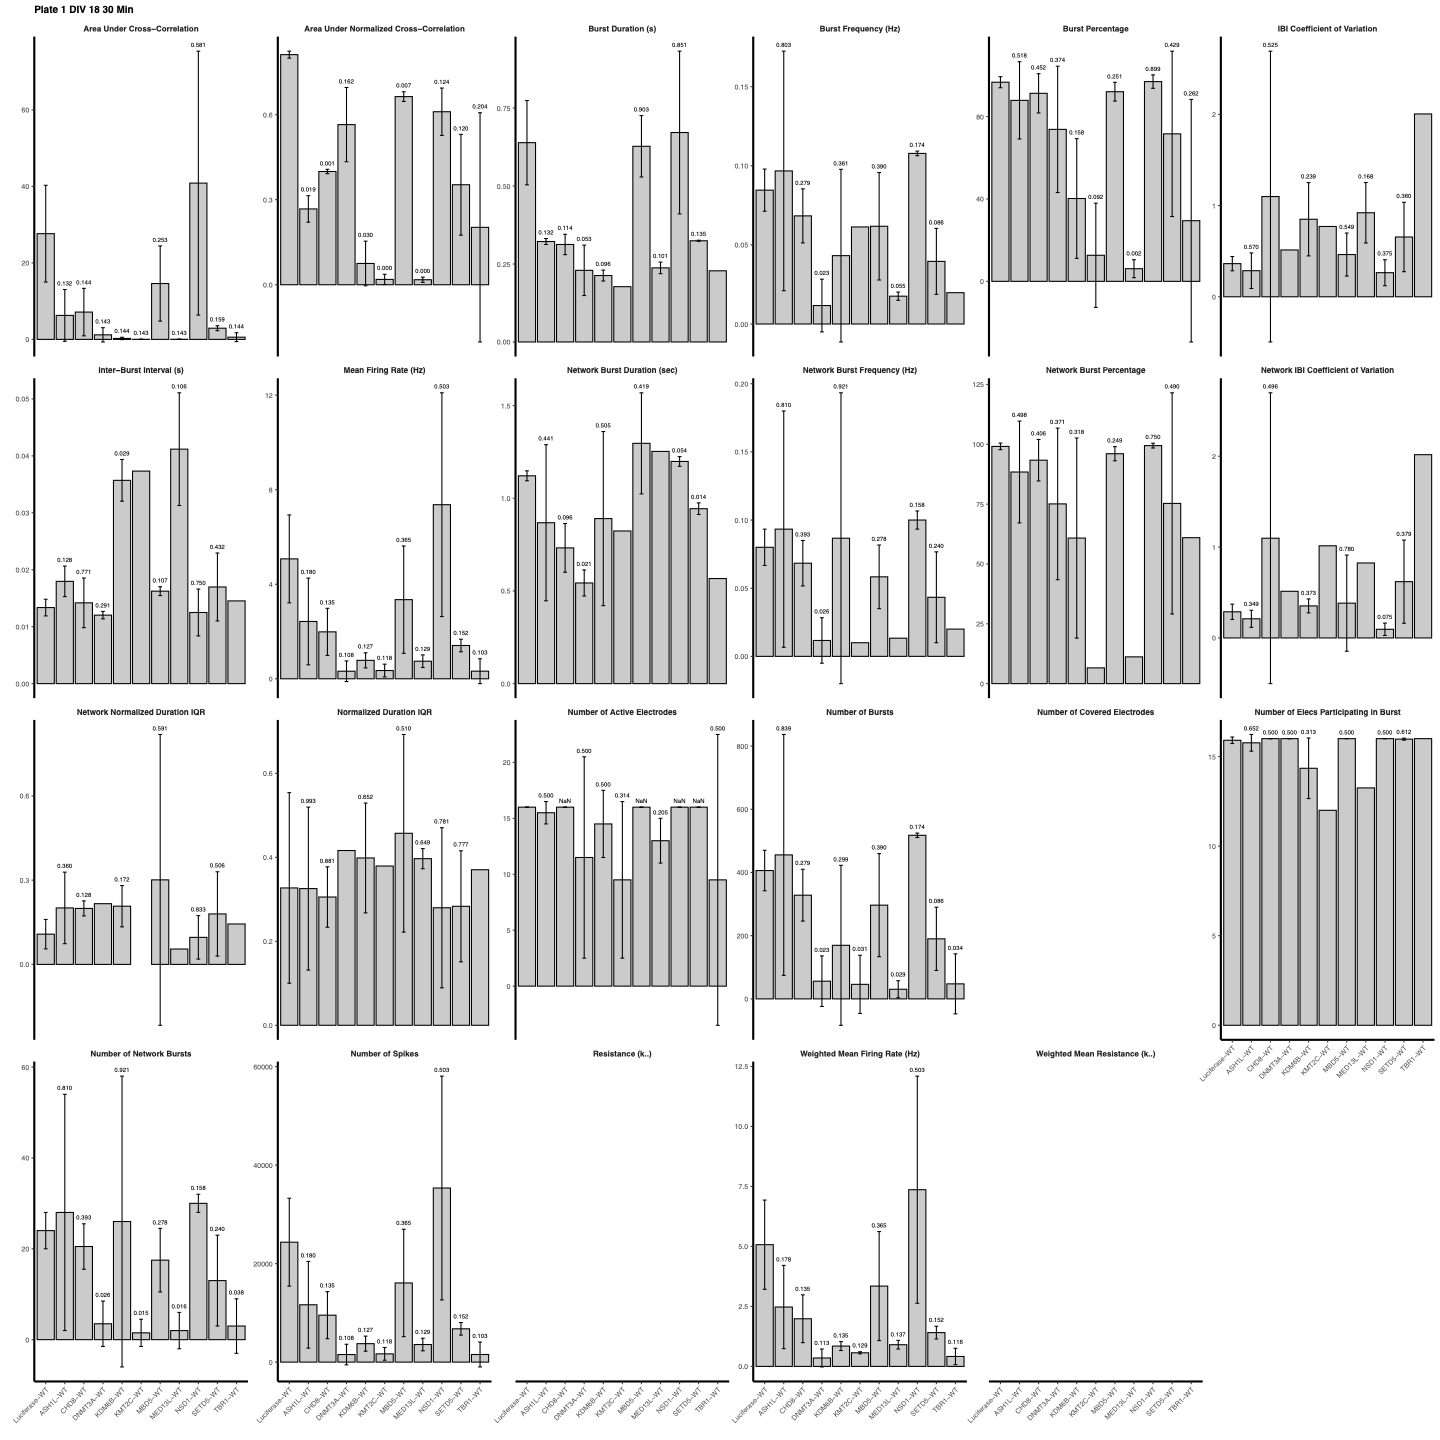 Bar plot of average measurement values for all metrics with given timepoint, control group, and treatment groups. Also include error bars illustrating T-test result p-value.
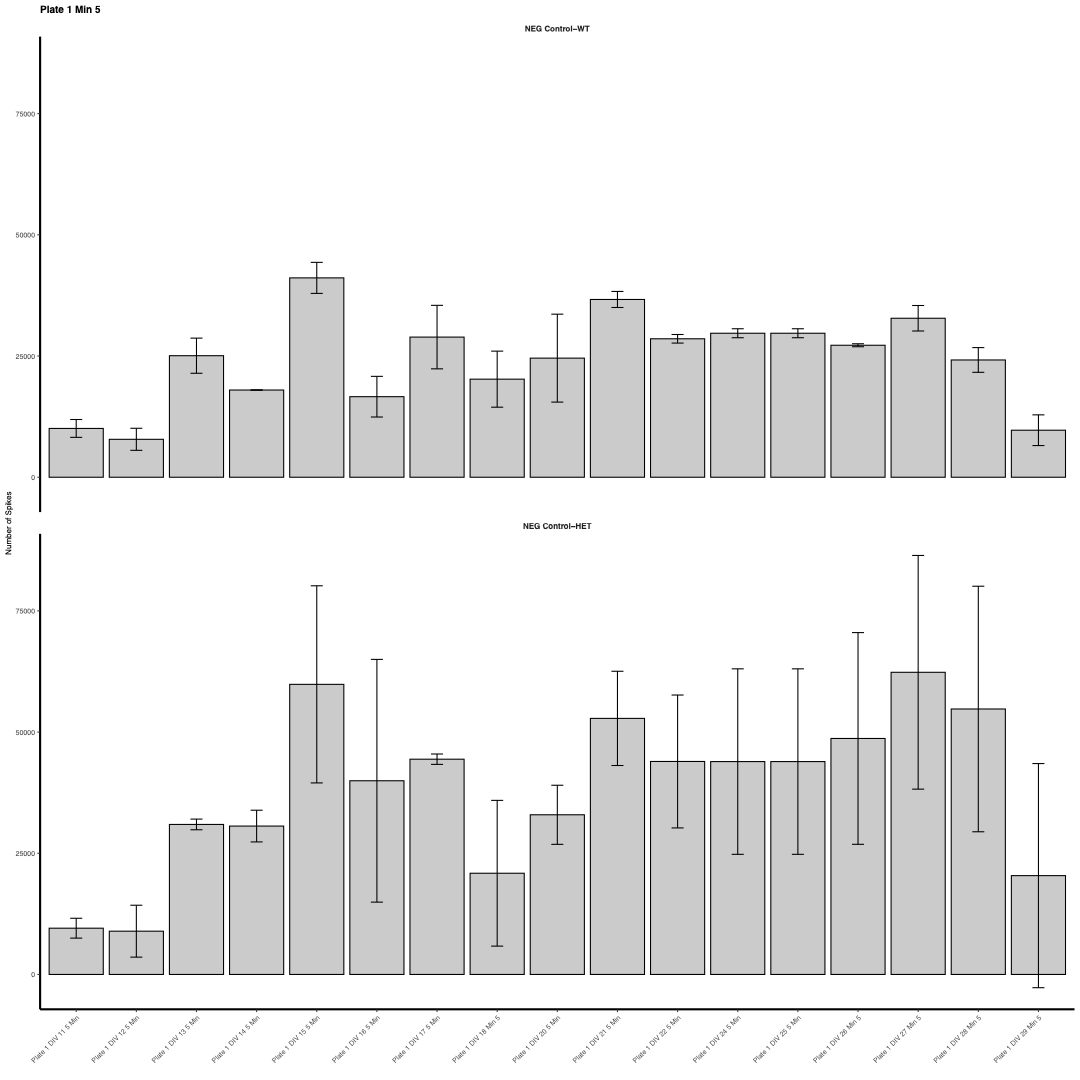 Bar plot of average measurements for a series of given timepoints for a specified measurement, given a control group and several treatment groups.
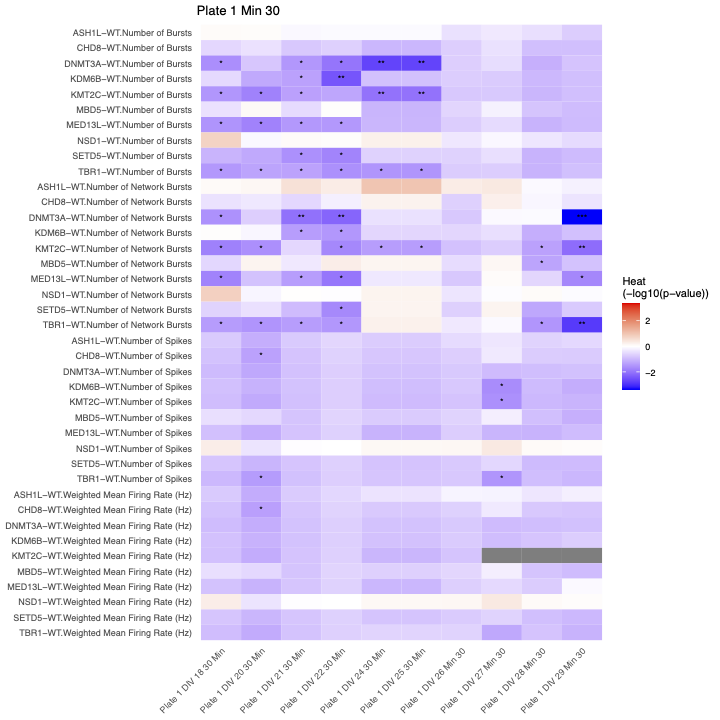 Significance table showing the p-value from t-test between average measurement of each metric’s control and treatments
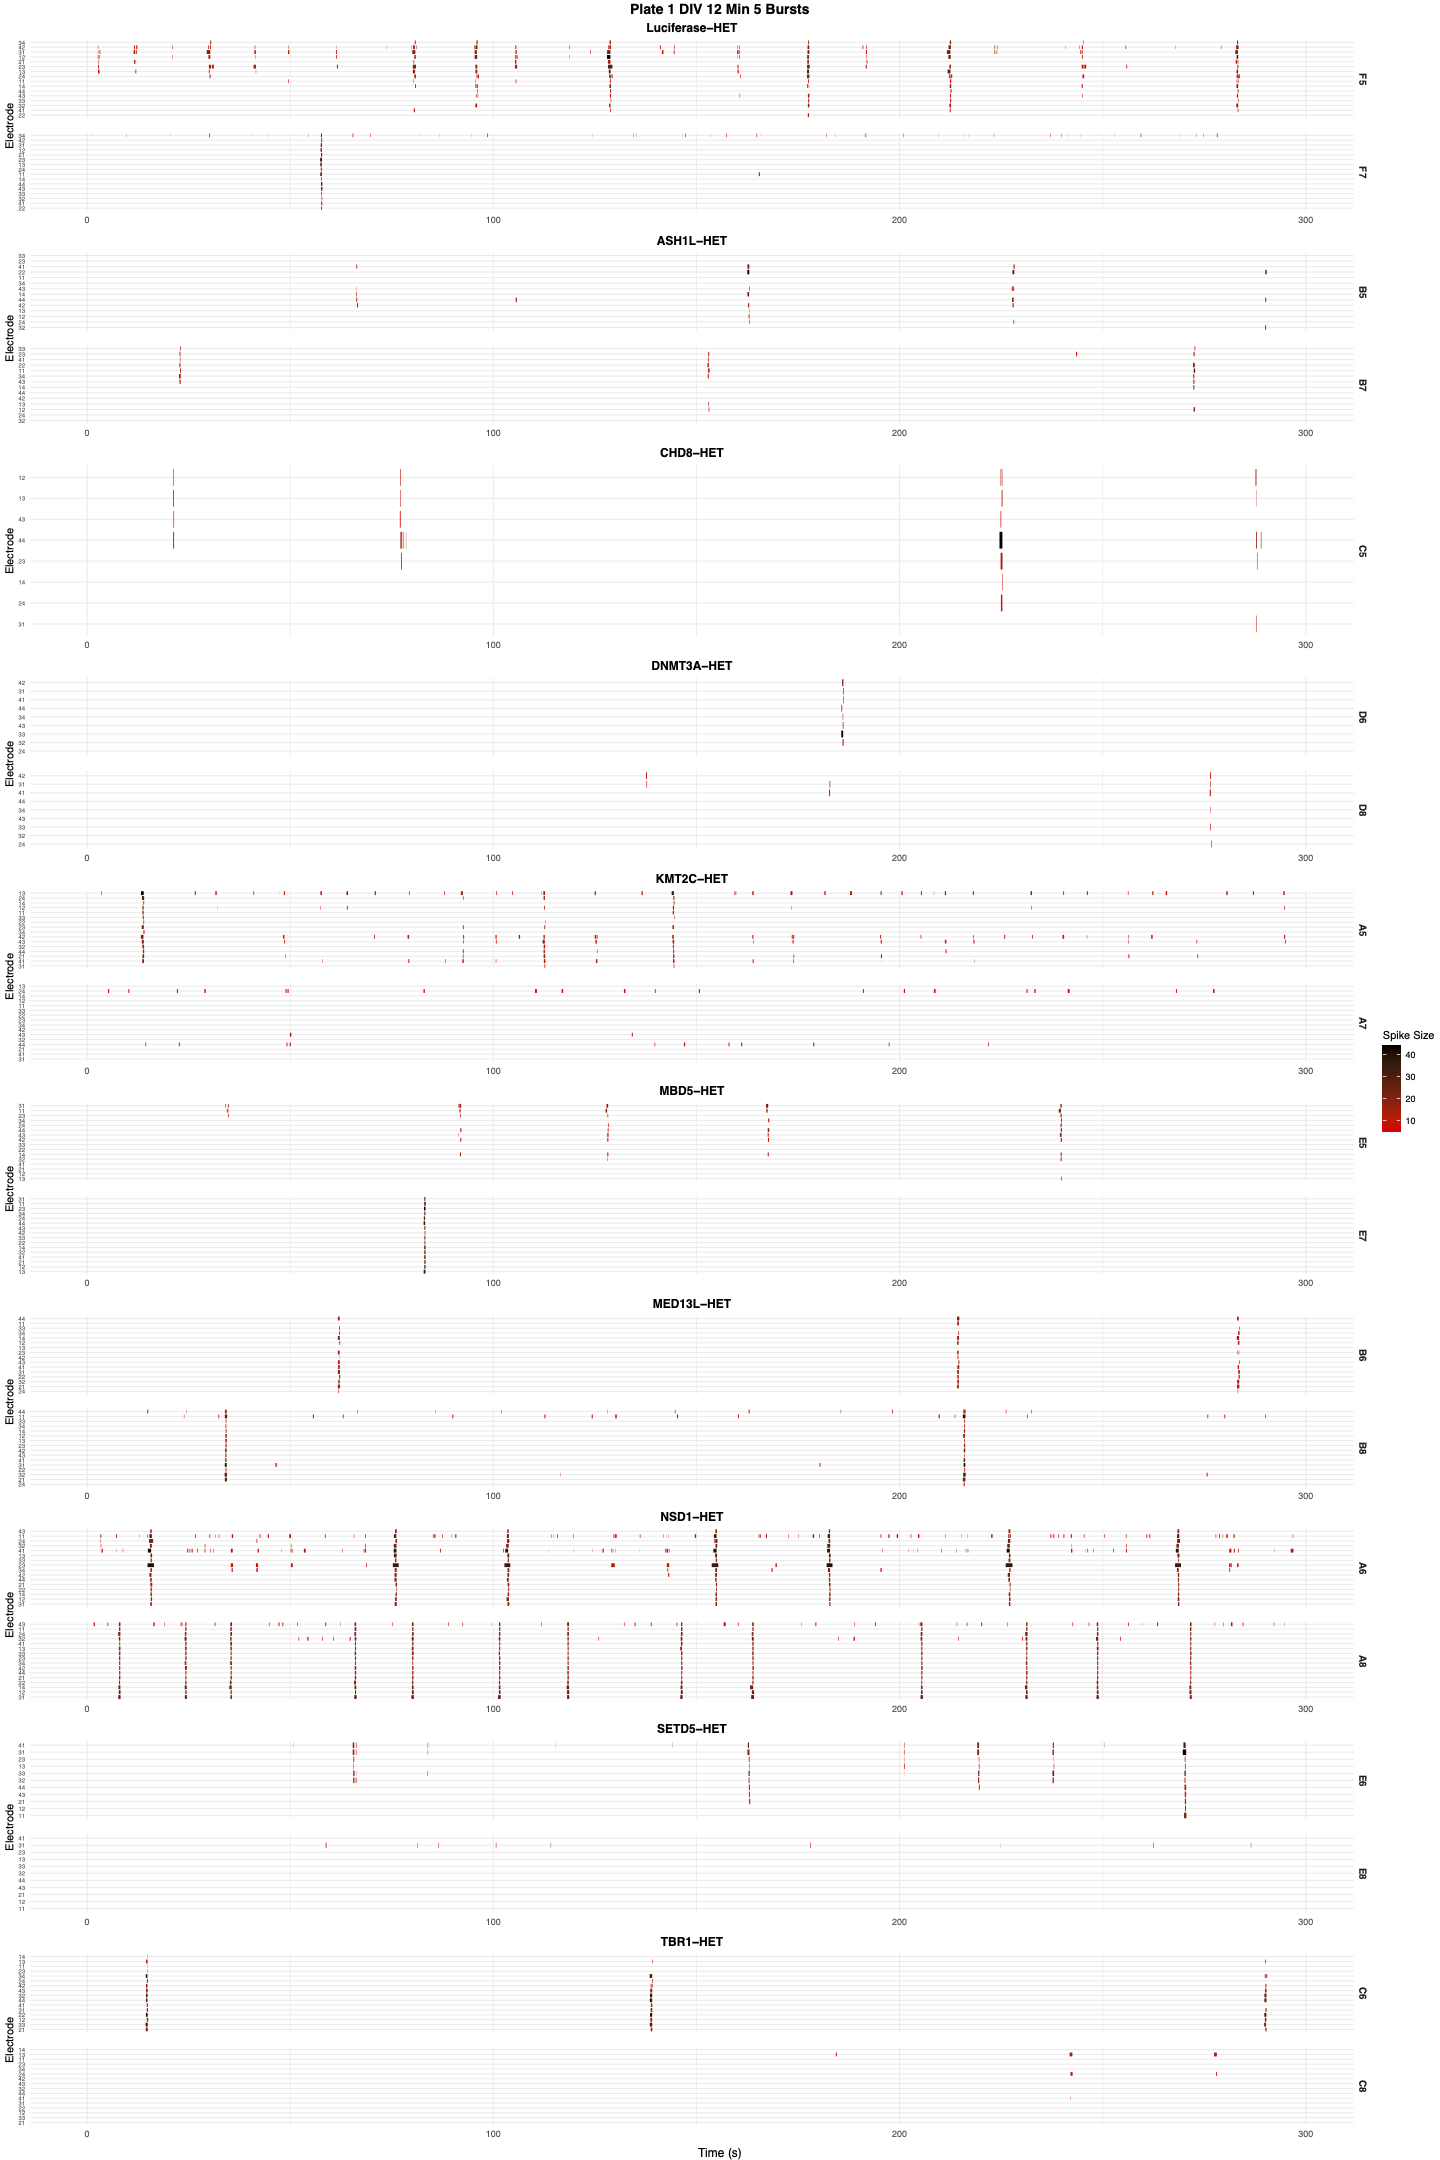 Raster showing neurons’ firing pattern by time, including information like spike duration and strength.
Installation
To install the MEA Analysis package, you can use the devtools package in R. If you don’t have devtools installed, you can install it first:
install.packages("devtools")
Then, you can install the MEA Analysis package directly from GitHub:
devtools::install_github("stevensusas/MEAnalysis")
After installation, load the package in your R session:
library(MEAnalysis)
Classes
MEAnalysis
The MEAnalysis class is the core of the package, providing methods for processing and analyzing MEA data.
Key methods:
-
treatment_averages_t_test_plot(control, groups_to_plot, title = NULL)- Parameters:
-
control: character - The name of the control group -
groups_to_plot: character vector - Names of groups to include in the plot -
title: character (optional) - The title of the plot
-
- Returns: ggplot object - A plot representing the t-test results for treatment averages
- Parameters:
BatchMEAnalysis
The BatchMEAnalysis class extends MEAnalysis to handle batch processing of multiple MEA data files.
Key methods:
-
run_mea_analysis(conditions, metric, control_condition = NULL, title = NULL)- Parameters:
-
conditions: character vector - Conditions to analyze -
metric: character - The specific metric to analyze -
control_condition: character (optional) - The control condition to compare against -
title: character (optional) - The title of the plot
-
- Returns: ggplot object - A plot representing the MEA analysis results
- Parameters:
-
generate_significance_overview(control_group, groups_to_include = NULL, metrics_to_visualize = NULL, title)- Parameters:
-
control_group: character - The control group to compare against -
groups_to_include: character vector (optional) - Specific groups to include in the analysis -
metrics_to_visualize: character vector (optional) - Specific metrics to visualize -
title: character - The title of the heatmap
-
- Returns: data.frame - A significance overview table
- Parameters:
ElectrodeBursts
The ElectrodeBursts class focuses on processing and visualizing electrode burst data.
Key methods:
-
create_comparison_raster_plot(control_group, treatments_array, plot_title)- Parameters:
-
control_group: character - The control group to be included in the comparison -
treatments_array: character vector - An array of treatment names to compare -
plot_title: character - The title of the plot
-
- Returns: ggpubr object - A combined raster plot comparing multiple treatments
- Parameters:
Usage
To use this package, start by initializing the appropriate class with your data file(s):
# For single file analysis
mea_analysis <- MEAnalysis$new("path/to/your/file.csv")

# For batch analysis
batch_analysis <- BatchMEAnalysis$new(list_of_file_paths)

# For electrode burst analysis
electrode_bursts <- ElectrodeBursts$new("path/to/your/file.csv")
Then, you can use the various methods provided by each class to analyze your data and generate plots. Here are some examples:
MEAnalysis
# Create a treatment averages t-test plot
plot <- mea_analysis$treatment_averages_t_test_plot(
  "Control",
  c("Treatment1", "Treatment2"),
  "Treatment Averages T-Test Plot"
)
# plot is a ggplot object
BatchMEAnalysis
# Run MEA analysis
plot <- batch_analysis$run_mea_analysis(
  c("Control", "Treatment1", "Treatment2"),
  "MeanFiringRate",
  "Control",
  "MEA Analysis Results"
)
# plot is a ggplot object

# Generate significance overview
overview <- batch_analysis$generate_significance_overview(
  "Control",
  c("Treatment1", "Treatment2"),
  c("MeanFiringRate", "BurstFrequency"),
  "Significance Overview"
)
# overview is a data.frame containing the significance overview
ElectrodeBursts
# Create a comparison raster plot
plot <- electrode_bursts$create_comparison_raster_plot(
  "Control",
  c("Treatment1", "Treatment2"),
  "Comparison Raster Plot"
)
# plot is a ggpubr object
Contributing
Contributions to improve the package are welcome. Please submit issues and pull requests on the project’s GitHub repository.
License
[Insert your chosen license information here]